Sequence Evolution and K-mer Similarity Analysis
Statistical analysis of protein and DNA sequence evolution using k-mer comparisons and randomization.
Overview
This project explores the statistical properties of sequence evolution in proteins and DNA, using k-mer similarity analysis and randomization tests. For a set of real and shuffled protein or DNA sequences, the project computes all k-mer pairs and analyzes their similarity scores (BLOSUM62 for protein, match/mismatch for DNA), visualizing their distributions and assessing normality with statistical tests.
Features
- Reads real or randomly shuffled FASTA sequences (protein or DNA).
- Extracts all k-mers of length
kfrom each sequence. - Performs exhaustive pairwise similarity scoring between all k-mers, using BLOSUM62 (proteins) or a simple match/mismatch scheme (DNA).
- Builds score histograms, boxplots, and QQ-plots for statistical inspection.
- Applies Kolmogorov-Smirnov tests for normality on the score distributions.
- Compares real versus shuffled (randomized) sequence statistics to test for evolutionary signal.
- Analyzes both protein and nucleotide sequences; supports back-translated DNA from proteins.
- Reports time and space complexity of the method.
How it Works
- K-mer Generation:
For each sequence, all overlapping k-mers of lengthkare generated (x-k+1k-mers per sequence, wherexis sequence length). - Pairwise Scoring:
Each pair of k-mers (from all sequences) is compared:- Protein: Scoring uses the BLOSUM62 matrix.
- DNA: 1 for a match, 0 for a mismatch.
- Distribution Analysis:
- All scores are tabulated into a histogram.
- Boxplots and QQ-plots are generated.
- Kolmogorov-Smirnov test is run for normality.
- Randomization:
Sequences are shuffled (with UShuffle) and the same analysis is repeated. - Visualization:
The distributions for eachkare visualized for both real and randomized data, allowing comparison of sequence evolutionary signals.
Example Usage
Protein Sequences:
-
randomp.fasta: Protein sequences. -
blosum62.txt: Scoring matrix (only needed for proteins). -
1: Flag for protein mode.
DNA Sequences:
-
randomd.fasta: DNA sequences (can be back-translated from protein). -
2: Flag for DNA mode (match/mismatch).
Algorithmic Complexity
- Let n = number of sequences, x = average length per sequence, k = k-mer length.
- Number of k-mers: n·(x-k+1)
- Total comparisons: [n·(x-k+1)] choose 2
- Overall time complexity: O(k · [n·(x-k+1)]²) — cubic in k, making analysis computationally intensive for large k.
Outputs
For each value of k:
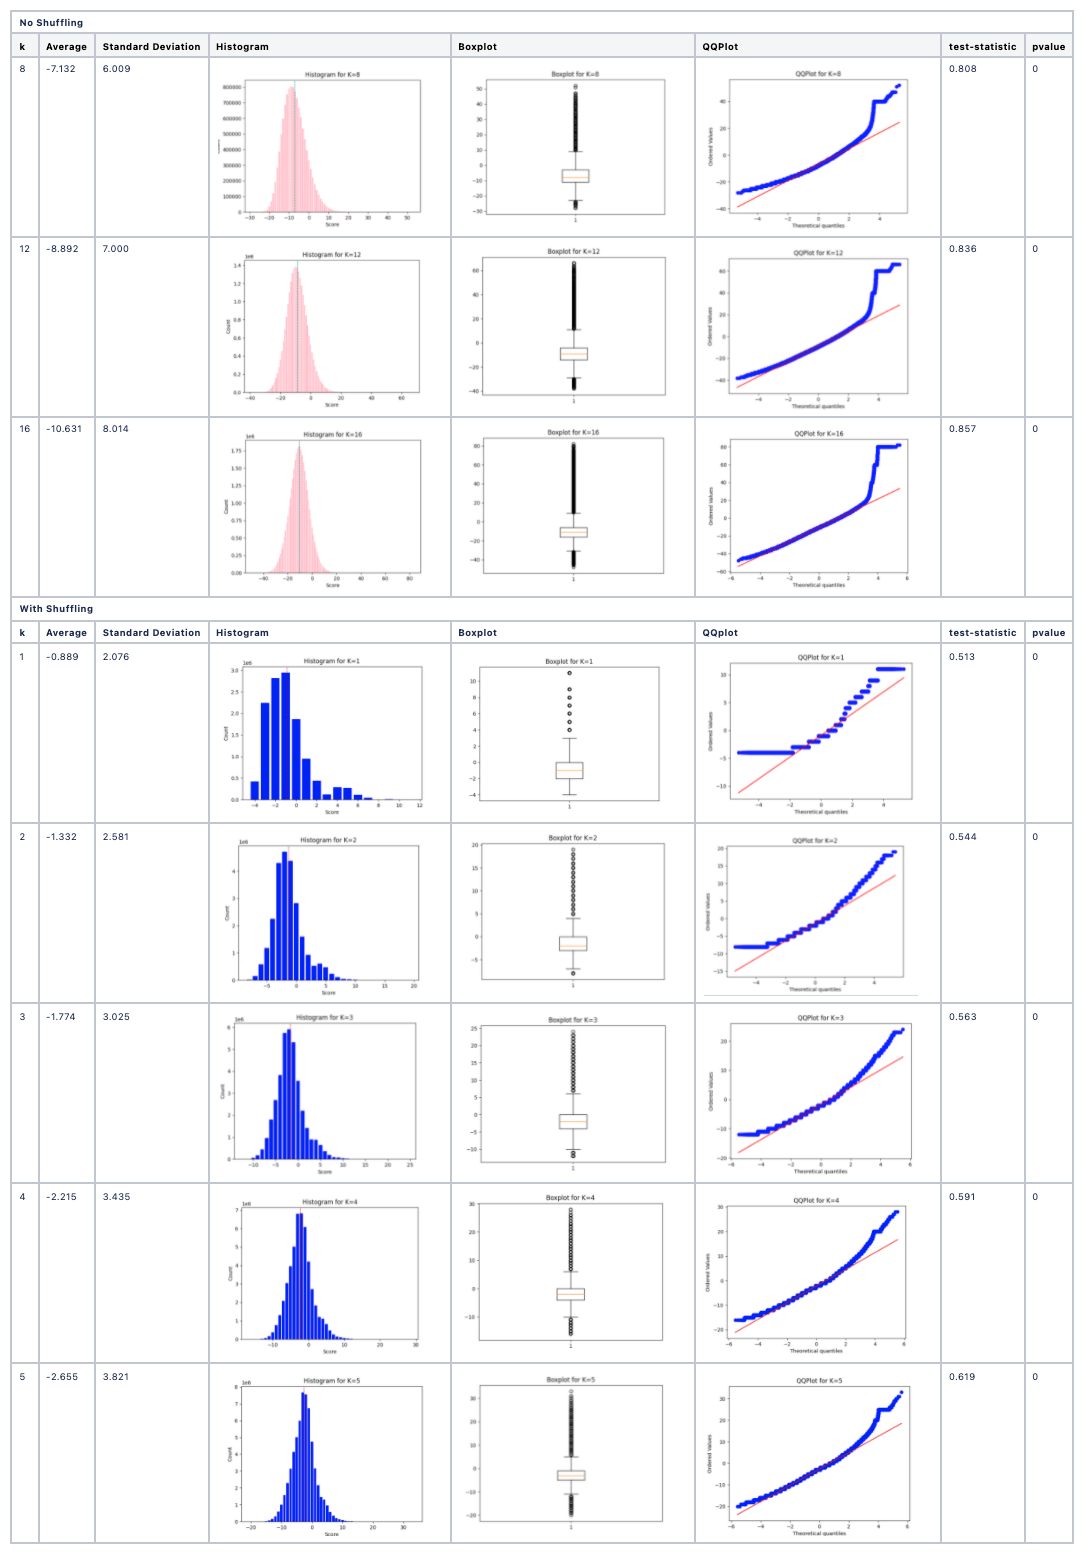
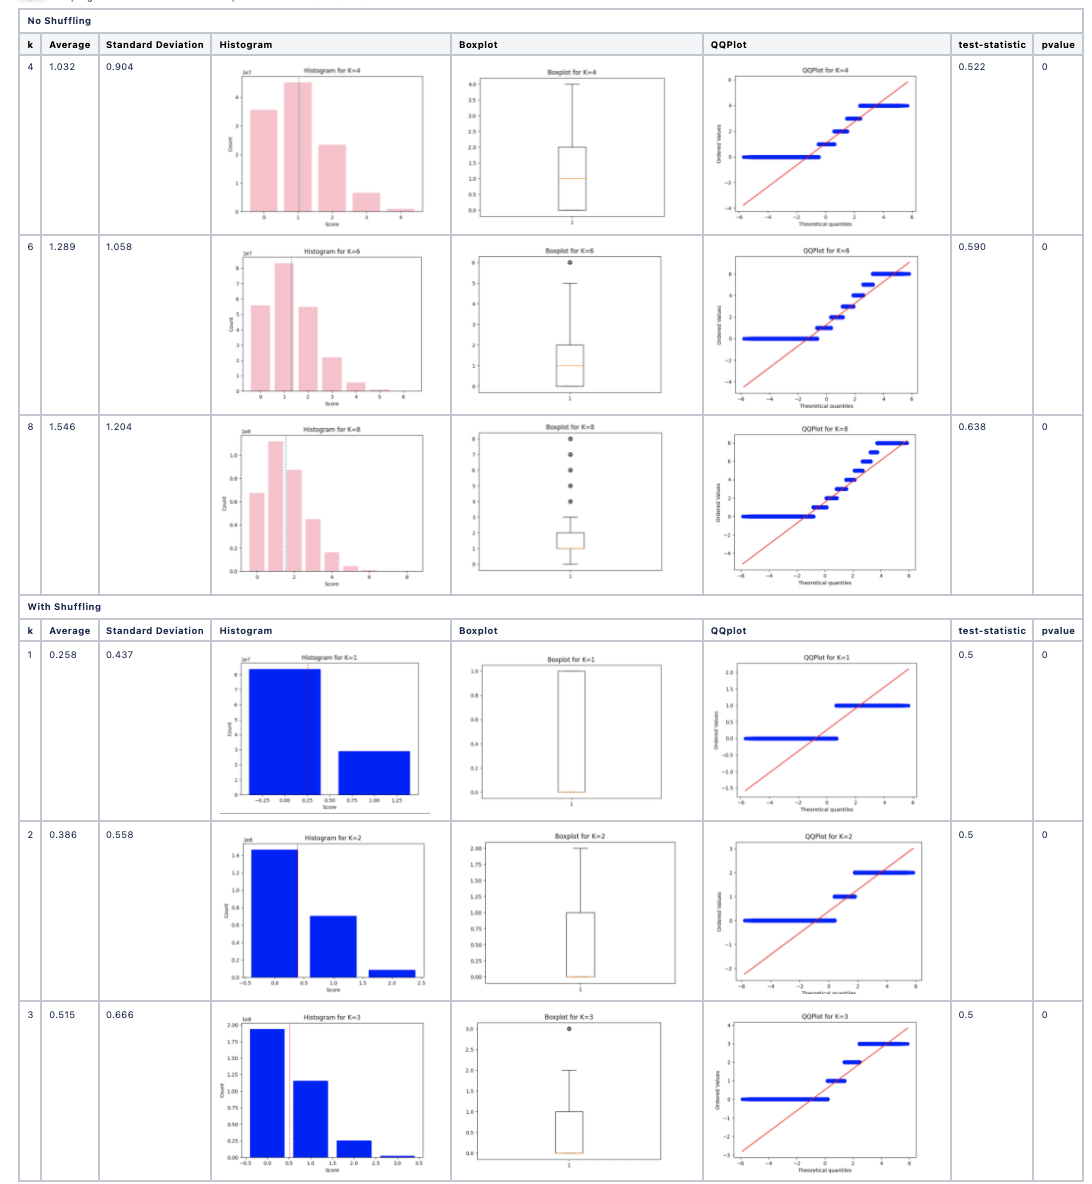
- Histogram of pairwise k-mer similarity scores.
- Boxplot and QQ-plot for visual assessment of normality.
- Kolmogorov-Smirnov test statistic and p-value.
The method is repeated for both real and randomized data to identify whether biological sequences show statistical signatures of evolutionary structure not explained by chance.
Example Results
- Real protein/DNA sequences: Score distributions often deviate from normality, especially at larger k.
- Randomized sequences: Score distributions tend toward normality, lacking evolutionary structure.
This approach provides statistical evidence for sequence evolution and structure at the k-mer level.
Files
-
randomization.py— Main analysis script. -
randomp.fasta,randomd.fasta— Example sequence files. -
blosum62.txt— BLOSUM62 substitution matrix for protein scoring.
Code
References
- UShuffle (for sequence randomization): Publication link